7 essential project indicators when managing your portfolio
 Portfolio indicators or Key Performance Indicators are paramount in having a global view of the organization and its project performance. In this article, we review the most important ones.
KPI 1: Internal demand in number of days / workers
When your organization manages internal projects, whether it be change projects or new product development, the client and the project sponsor will from within the company. That is why, when poorly managed, internal project portfolios can become crazy races, causing disputes between the various promoters as they try to get ahead of each other in order to increment the team staff, acquire additional funding or the favour of the board of directors.
Try ITM Platform and know the status of your project portfolio at all times
Therefore, it is very important to be clear, at all times, about what the total internal demand of each area of the organization is generating for its different projects. It is true that you can rely on what is the largest project or what are the criteria to incur costs, but while the first is a partial indicator, the second does not allow you to see the development of the planned workload. The internal client demand indicator is the perfect KPI for this purpose. Thanks to this, you will know how many days of work each department or functional area of your company generates in the project teams. This information is not only valuable for the CIO and the CEO, but can also help you establish a maximum demand limit for days worked related to the organization (throughout time).
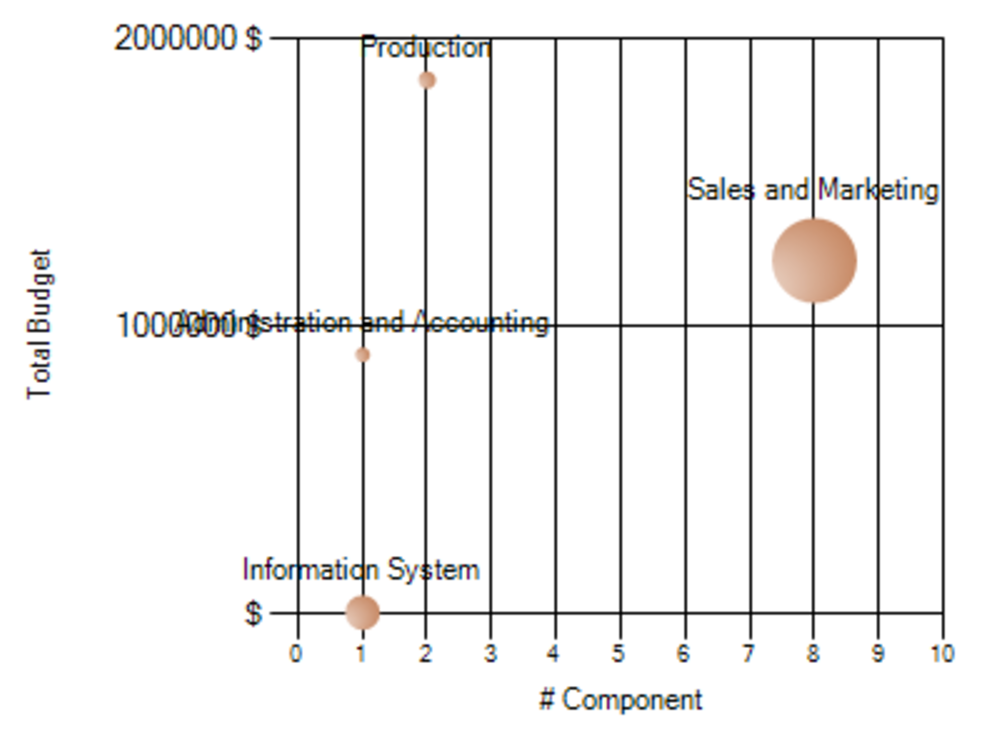 Of course, if there are transversal projects that involve several departments, it is essential to have a good system of project allocation, so that the information contained in the system is not distorted and the indicator is actually useful.
KPI 2: Employees by professional profile
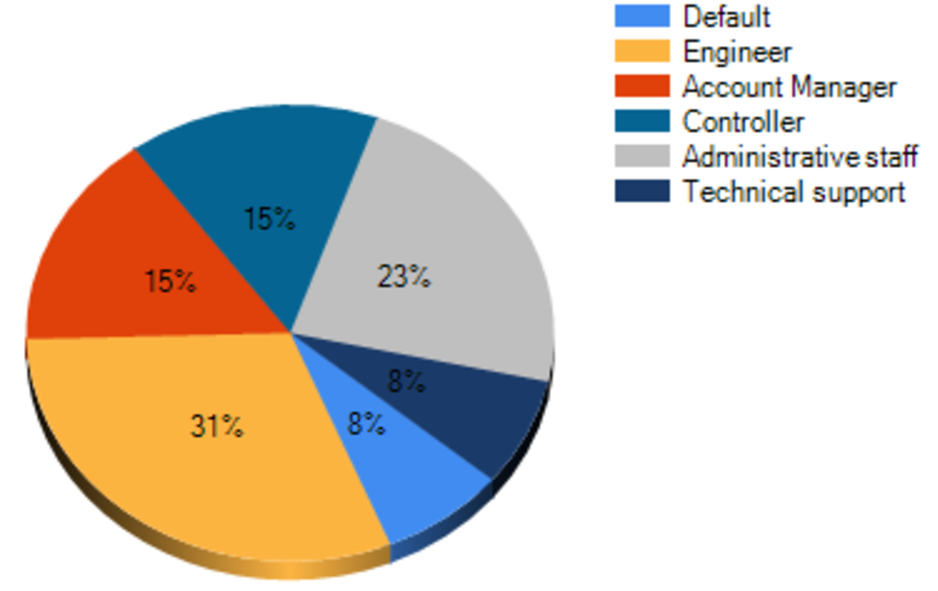
If your organization relies on consultants for your projects, it is very possible that the available skills vary greatly over time. Today you could have four experts in programming JavaScript and none in four months. Hence, it is important to be clear at all times what the composition of your human resources by professional profiles are. The evolution of this indicator will facilitate the work of your PMO, the planning of resources as well as the identification of gaps or oversupply. In addition, graphics are very useful for the management team, as they easily communicate the structure of the personnel involved in projects.
KPI 3: Estimating effort
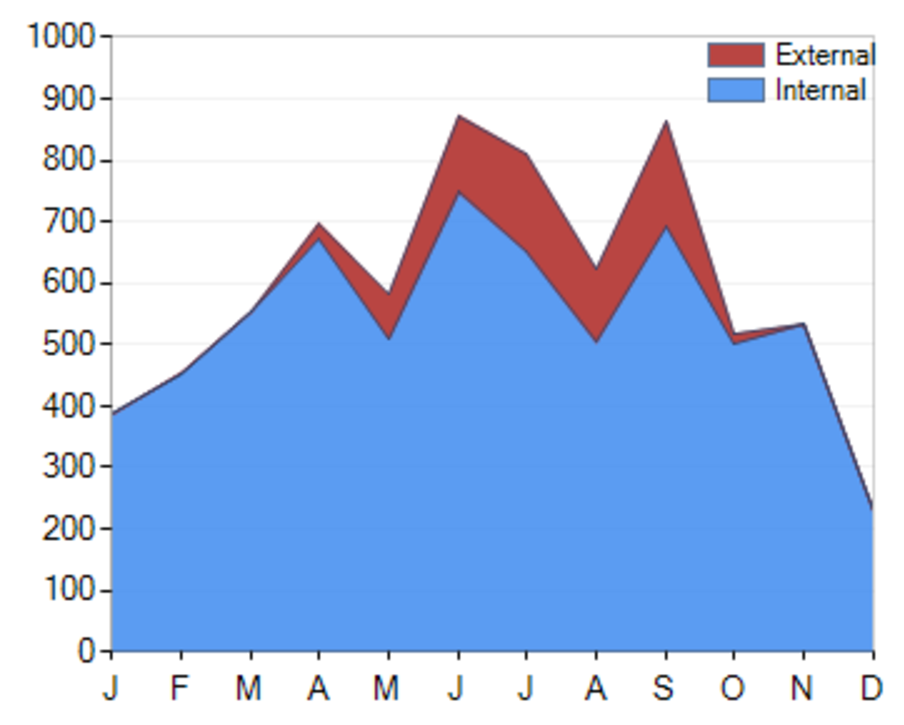
The previous indicator would do little to manage the portfolio if we could not anticipate the future needs of certain profiles. For this, it is essential to have a view of the estimated efforts in the coming months. Each project manager takes into account where the greatest effort is concentrated in for the projects for which he is responsible for, but very few have the necessary information to know if the “hot seasons” of each project coincide. From such a chart, portfolio managers would know when there is a greater risk of scarcity of certain skills and can plan accordingly. In the given example, the busiest months are June, September, July and April, respectively.
KPI 4: Budget by objectives
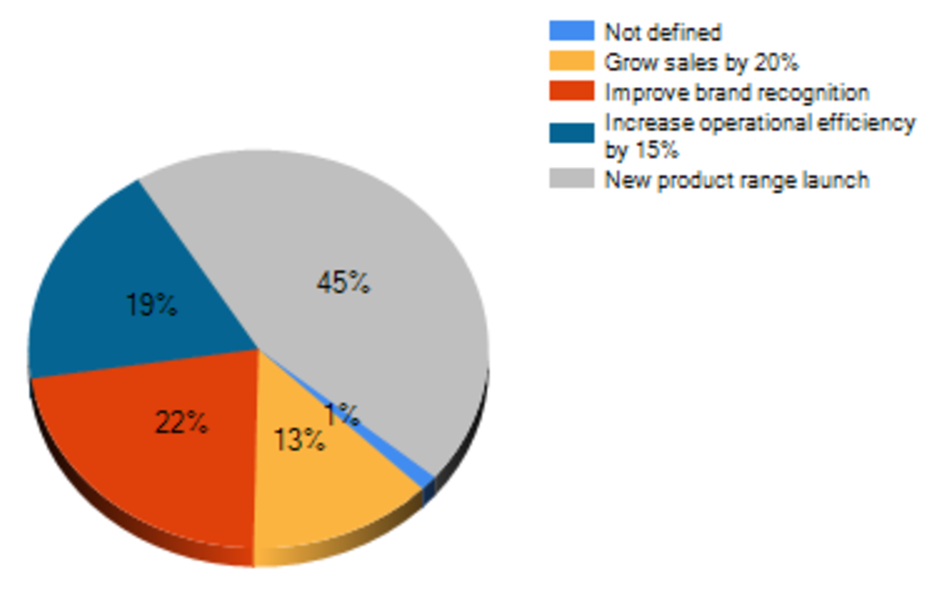 Within the economic indicators, one of the most interesting from the point of view of the portfolio is the one that indicates the aggregate investment that is being allocated to each one of the objectives of the organization. This indicator should serve as confirmation that the management of the project portfolio is following the strategic guidelines established by the highest management bodies. If a goal has the highest priority, it is logical that it is receiving the highest share of investment. Any contrary discrepancy must have sufficiently justified grounds. In the given example, if sales growth were more important to managers than increased operational efficiency, the portfolio should be revised to ensure that total investments in these areas correspond to the priorities. It is possible that the operational improvement currently has a very expensive project of change but of limited duration, after which completion the percentages would be re-adjusted.
KPI 5: Process budgeting
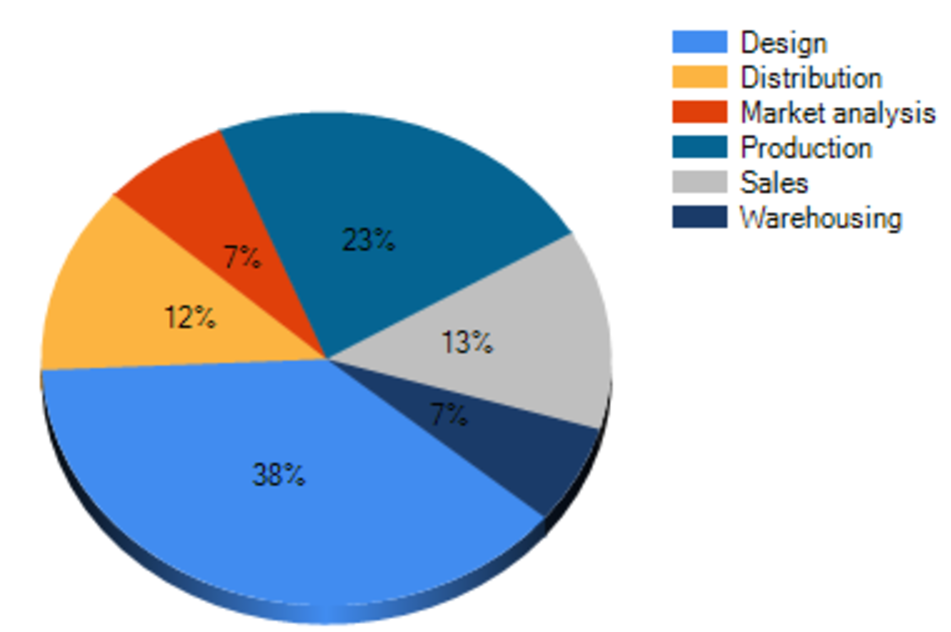 What business processes are absorbing more investment? In conjunction with the domestic demand indicator, this indicator leads to optimization, cost reduction and the elimination of redundancies and inefficiencies. Processes that are considered marginal and low value-added often consume resources for administrative and maintenance reasons that are difficult to reduce. However, it is crucial to know what the natural or average value of this indicator is and to ensure that it never rises above it. In the given image, assume that the average cost of storage for ‘GlobalCorp360’ is at 8%. If at any time it rises above 12% for no apparent reasons, this becomes alarming and yields more than enough evidence to submit the process to an audit.
KPI 6 and 7: Budget by component and current cost per component
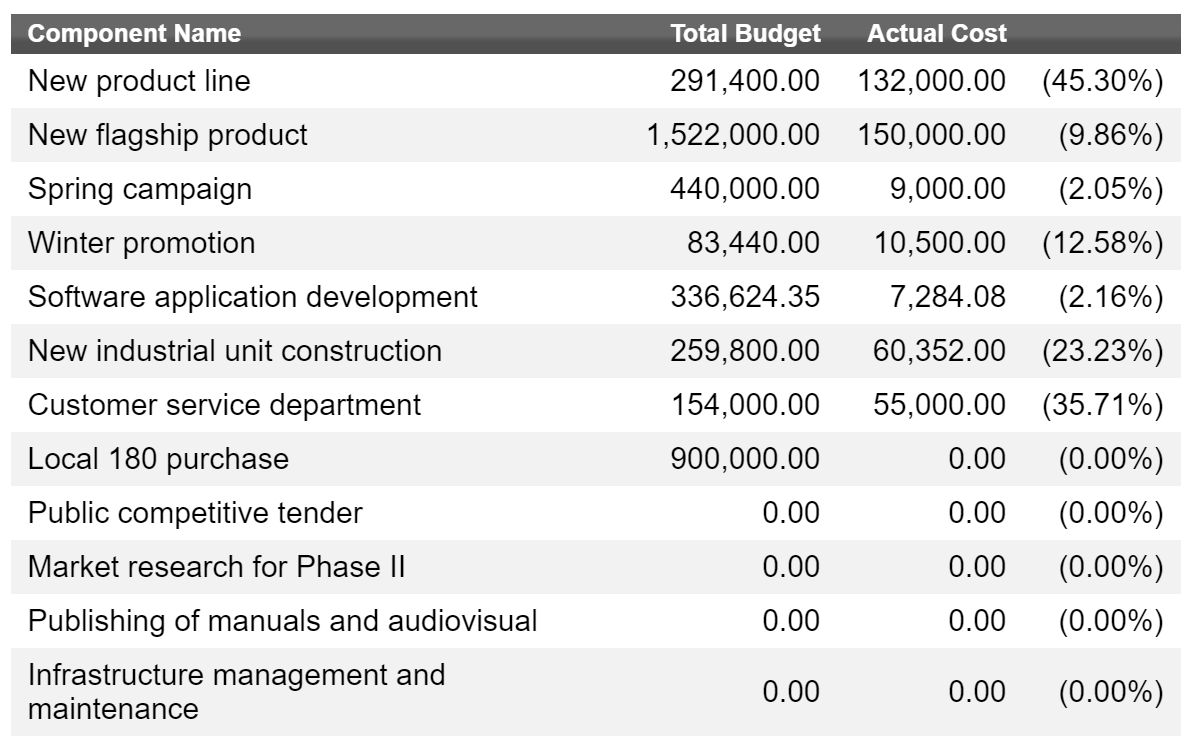 The simplest indicator, which shows the budgets for each of the projects involved, remains the most useful for the portfolio manager. As with the calendar for an event manager, the director of a portfolio should always have before him a written reference of the budget of each project. The person responsible for a portfolio must demand the highest precision of the budgets and the costs incurred by each project. For the same reason, it is essential to have a solution that, like ITM Platform, updates the information immediately each time a new invoice is registered, without having to wait for periodic reports.
Receive the latest blogs directly into your inbox
I agree to ITM Platform's [privacy policy](http://www.itmplatform.com/en/terms-of-use-and-privacy-policy/#PrivPol) Submit